July 2, 2018
Edit: If you’re viewing this in modernity, use https://github.com/nextjournal/clerk instead. I promise you’ll be very happy.
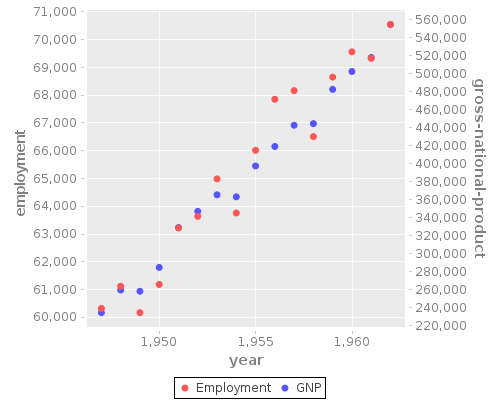
Incanter doesn’t have a built in way to add an additional Y-axis.
(defn merge-y-axis
  "Merge the Y axis of two line / time series charts. The former chart will have
  the left Y axis, and the latter will have the right."
  [^JFreeChart chart ^JFreeChart chart-to-merge]
  (let [^XYPlot plot (.getPlot chart-to-merge)]
    (doto ^XYPlot (.getPlot chart)
      (.setRangeAxis 1 (.getRangeAxis plot))
      (.setDataset 1 (.getDataset plot))
      (.mapDatasetToRangeAxis 1 1)
      (.setRenderer 1 (.getRenderer plot)))
    (-> (.getPlot chart)
        (.getLegendItems)
        (.addAll (.getLegendItems plot)))
    chart))
Then you can
~/$ lein repl
user=> (use '(incanter core datasets charts))
user=>
;; Get built in employment dataset
(let [[employment _ gross-national-product _ _ _ year] (to-vect (trans (to-matrix data)))]
	;; Plot year / employment on the first axis
	(doto (scatter-plot year employment :series-label "Employment" :legend true)
		;; Merge in another chart that plots year / gross national product
		(merge-y-axis (scatter-plot year gross-national-product :series-label "GNP" :legend true)
		(view))))
and you’ll get